Press Release – Q3 2018
Matrix announces the results of the third quarter of 2018 and of the first nine months of 2018
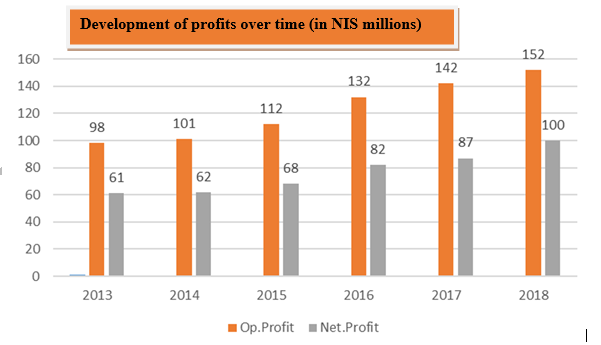
Matrix revenues in the first nine months of 2018 grew by about 10% to NIS 2.3B, and net profit grew by about 15.8% to approximately NIS 100.2M
Today, Matrix published its results for the third quarter of 2018 and presented continued growth in revenues, operating profit, and net profit in the first nine months of the year (the period). Revenues in the first nine months of the year grew by about 10%, to approximately NIS 2.3B, compared with approximately NIS 2.1B in the corresponding period of the previous year. Operating profit in the period increased by about 7.3%, to approximately NIS 152.3M, compared with approximately NIS 141.8M in the corresponding period of the previous year. Net profit grew by about 15.8%, to approximately NIS 100.2M, compared with approximately NIS 86.5M in the corresponding period of the previous year.
In the third quarter, the revenues of Matrix grew by about 4.4% and amounted to approximately NIS 757.4M, compared with approximately NIS 725.8M in the corresponding quarter of the previous year. Operating profit reached approximately NIS 50.1M compared with approximately NIS 34M in the corresponding quarter of the previous year. The results of activity in the quarter were affected by the High Holidays of Tishrei, which this year have entirely coincided with the third quarter (as opposed to being divided between the third and fourth quarters, as in the previous year). The number of work hours, which constitutes a significant factor in the revenues and profitability of the company, was 6% lower in the quarter than in the corresponding quarter of the previous year.
Equity and cash balances
At the end of the third quarter of 2018, Matrix shareholders’ equity reached approximately NIS 688M, compared with approximately NIS 636M at the end of the corresponding quarter of the previous year. Cash and short-term investments reached approximately NIS 231M, compared with approximately NIS 225M in the previous year.
Dividends
Matrix continues its policy of distributing quarterly dividends at a rate of up to 75% of net profit. This morning, the company announced a dividend of approximately NIS 22.2M (36 agorot per share). With the dividend announced today, the dividends distributed by the company since the beginning of the year amount to approximately NIS 102M. In the past decade, Matrix distributed dividends in the cumulative amount of approximately NIS 870M.
Moti Gutman, CEO of Matrix: “We complete the first nine months of the year with all the indices on the rise. The third quarter of the year was affected by a significant decrease in the number of work hours because of the holidays, which this year fell entirely in the third quarter. From the perspective of the period, from the beginning of the year, the results reflect the impressive, continued growth in revenues and profitability of Matrix. Matrix continues its growth and employee recruitment momentum, as a result of winning new projects, some of them mega-projects, of entering new fields, and of continuing acquisitions and mergers. Today there are facing several opportunities in the market, which we are working to realize. The first one is the expansion of the digital activity of our customers, which is a major growth engine for our activities in the coming years. Second, the serious shortage of technological personnel creates an opportunity in the areas of technology training, placement, and offshore and near-shore services, including our innovative and unique training courses, such as Infinity Labs. In parallel, we are continually working on expanding in the US and Israeli markets through acquisitions in synergetic areas of activity. Finally, after a period of organization of the US sales system, we can now reap the rewards. In the last quarter and the first nine months of 2018, operations of Matrix in the US show impressive growth in revenues and profitability. About 13% of the revenues for the period and 26% of the profit come from the American market. ”
Summary of reports on income for the three months and nine months ending on September 30, 2018 and 2017 (in NIS thousands)
* When using mobile, the table is best viewed in landscape
| For three months ending on | Change in % | For nine months ending on | Change in % | |||
| 30.09.18 | 30.09.17 | 30.09.18 | 30.09.17 | |||
| Turnover | 757,470 | 725,863 | 4.4%+ | 2,297,331 | 2,091,079 | 9.9%+ |
| Cost of sales and services | 649,818 | 620,105 | 1,969,331 | 1,788,073 | ||
| Gross profit | 107,652 | 105,758 | 1.8%+ | 328,000 | 303,006 | 8.2%+ |
| % | 14.2% | 14.6% | 14.3% | 14.5% | ||
| Sales and marketing expenses | 24,091 | 22,603 | 75,632 | 66,879 | ||
| Management and general expenses | 33,439 | 30,866 | 100,066 | 94,243 | ||
| Operating profit | 50,122 | 52,289 | 4.2%- | 152,302 | 141,884 | 7.3%+ |
| % | 6.6% | 7.2% | 6.6% | 6.8% | ||
| Financing costs | 9,462 | 7,932 | 21,627 | 24,949 | ||
| Financing gains | (182) | 150 | 1,569 | (431) | ||
| The Company’s share in the profits (losses) of affiliated companies | (52) | (31) | (73) | (58) | ||
| Profit before taxes | 40,426 | 44,476 | 132,171 | 116,446 | ||
| Taxes on income | 9,461 | 10,457 | 31,897 | 29,850 | ||
| Net profit | 30,965 | 34,019 | 9%- | 100,274 | 86,596 | 15.8%+ |
| % | 4.1% | 4.7% | 4.4% | 4.1% | ||
| Net profit of: | ||||||
| Owners of capital rights in the company | 29,601 | 33,004 | 96,459 | 83,854 | ||
| Minority rights | 1,364 | 1,015 | 3,815 | 2,742 | ||
| Net profit | 30,965 | 34,019 | 9%- | 100,274 | 86,596 | 15.8%+ |
| EBITDA | 57,656 | 58,328 | 1.2%- | 174,027 | 160,555 | 8.4%+ |
| % | 7.6% | 8% | 7.6% | 7.6% | ||
The first nine months of 2018 across five segments of activity
Revenues in the Software solutions and services sector in the first nine months of the year amounted to approximately NIS 1.44B, compared with approximately NIS 1.34B in the corresponding period of the previous year, an increase of about 7.9%. Operating profit in the Software solutions and services sector amounted to approximately NIS 73.1M in the period, an increase of about 3.1%, compared with approximately NIS 70.9M in the corresponding period of the previous year.
Revenues from the Software solutions and services in the US amounted to approximately NIS 298.3M ($84M) in the first nine months of the year, an increase of about 21.6%, compared with approximately NIS 245.3M ($67.8M) in the corresponding period of the previous year (an increase of about 23.9% in dollars). Operating profit in the US reached approximately NIS 40.5M ($11.4M) for the period, compared with approximately NIS 31.7M ($8.9M) in the corresponding period of the previous year, an increase of 28% in both NIS and dollars. The increase in revenues, profit, and profit margin is due to the organic growth of operations and the initial consolidation of the acquired companies, PVBS and Alius.
Revenues from the Marketing and support of software products sector reached approximately NIS 108.8M in the period, compared with approximately NIS 93.5M in the corresponding period of the previous year, an increase of about 16.3%. Operating profit in this sector amounted to approximately NIS 12.6M, compared with approximately NIS 13.8M in the corresponding period of the previous year. The decrease in the profitability of the sector is due mainly to the transition from the software acquisition model to the subscription-based billing model. This move harms the profitability in the short term, but in the long term contributes to creating the desirable recurring revenue base.
Revenues from the Integration and infrastructure solutions sector amounted to approximately NIS 392M in the first nine months of the year, an increase of about 5.9%, compared to approximately NIS 370.2M in the corresponding period of the previous year. Operating profit in the Integration and infrastructure sector reached approximately NIS 16.1M, compared with approximately NIS 14M in the corresponding period of the previous year, an increase of about 14.3%.
Revenues for the period in the Training and deployment sector also increased and reached approximately NIS 129.8M, compared with approximately NIS 123.8M in the corresponding period of the previous year, an increase of about 4.8%. Operating profit in this sector increased by about 5.8% and reached approximately NIS 12.8 million, compared with approximately NIS 12.1M in the corresponding period of the previous year.